15 Best Cities to Own a Vacation Rental


Editor’s Note: This story originally appeared on LawnStarter.
Thanks to vacation rental marketplaces like Airbnb and Vrbo, anyone can earn extra cash by renting out their spare room, mother-in-law suite, or entire home to tourists.
In the U.S., short-term rental hosts can rake in an average of over $44,000 per year, according to market analysis firm AllTheRooms. But as with all real estate investments, your income potential depends heavily on where you buy your vacation rental property.
To help you find the right spot for your future B&B, LawnStarter ranked 2022’s Best Cities to Own a Vacation Rental.
We compared nearly 190 of the biggest U.S. cities based on revenue potential, initial investment costs, and average expenses. We also factored in entertainment options for guests, public safety, and climate.
Check out the top cities to own a vacation rental below.
1. Miami, FL

Overall score: 67.18
Revenue potential rank: 1
Initial investment rank: 138
Overhead rank: 22
Entertainment rank: 7
Safety rank: 146
Climate rank: 46
2. New York, NY

Overall score: 66.98
Revenue potential rank: 4
Initial investment rank: 154
Overhead rank: 115
Entertainment rank: 1
Safety rank: 68
Climate rank: 56
3. New Orleans, LA

Overall score: 60.49
Revenue potential rank: 7
Initial investment rank: 99
Overhead rank: 39
Entertainment rank: 10
Safety rank: 109
Climate rank: 55
4. Cincinnati, OH

Overall score: 59.20
Revenue potential rank: 2
Initial investment rank: 88
Overhead rank: 51
Entertainment rank: 41
Safety rank: 120
Climate rank: 96
5. Las Vegas, NV

Overall score: 58.99
Revenue potential rank: 26
Initial investment rank: 81
Overhead rank: 70
Entertainment rank: 4
Safety rank: 18
Climate rank: 163
6. Dayton, OH

Overall score: 58.53
Revenue potential rank: 9
Initial investment rank: 29
Overhead rank: 12
Entertainment rank: 105
Safety rank: 51
Climate rank: 102
7. Tampa, FL

Overall score: 57.57
Revenue potential rank: 14
Initial investment rank: 63
Overhead rank: 94
Entertainment rank: 24
Safety rank: 15
Climate rank: 57
8. Knoxville, TN

Overall score: 57.56
Revenue potential rank: 49
Initial investment rank: 25
Overhead rank: 7
Entertainment rank: 50
Safety rank: 78
Climate rank: 68
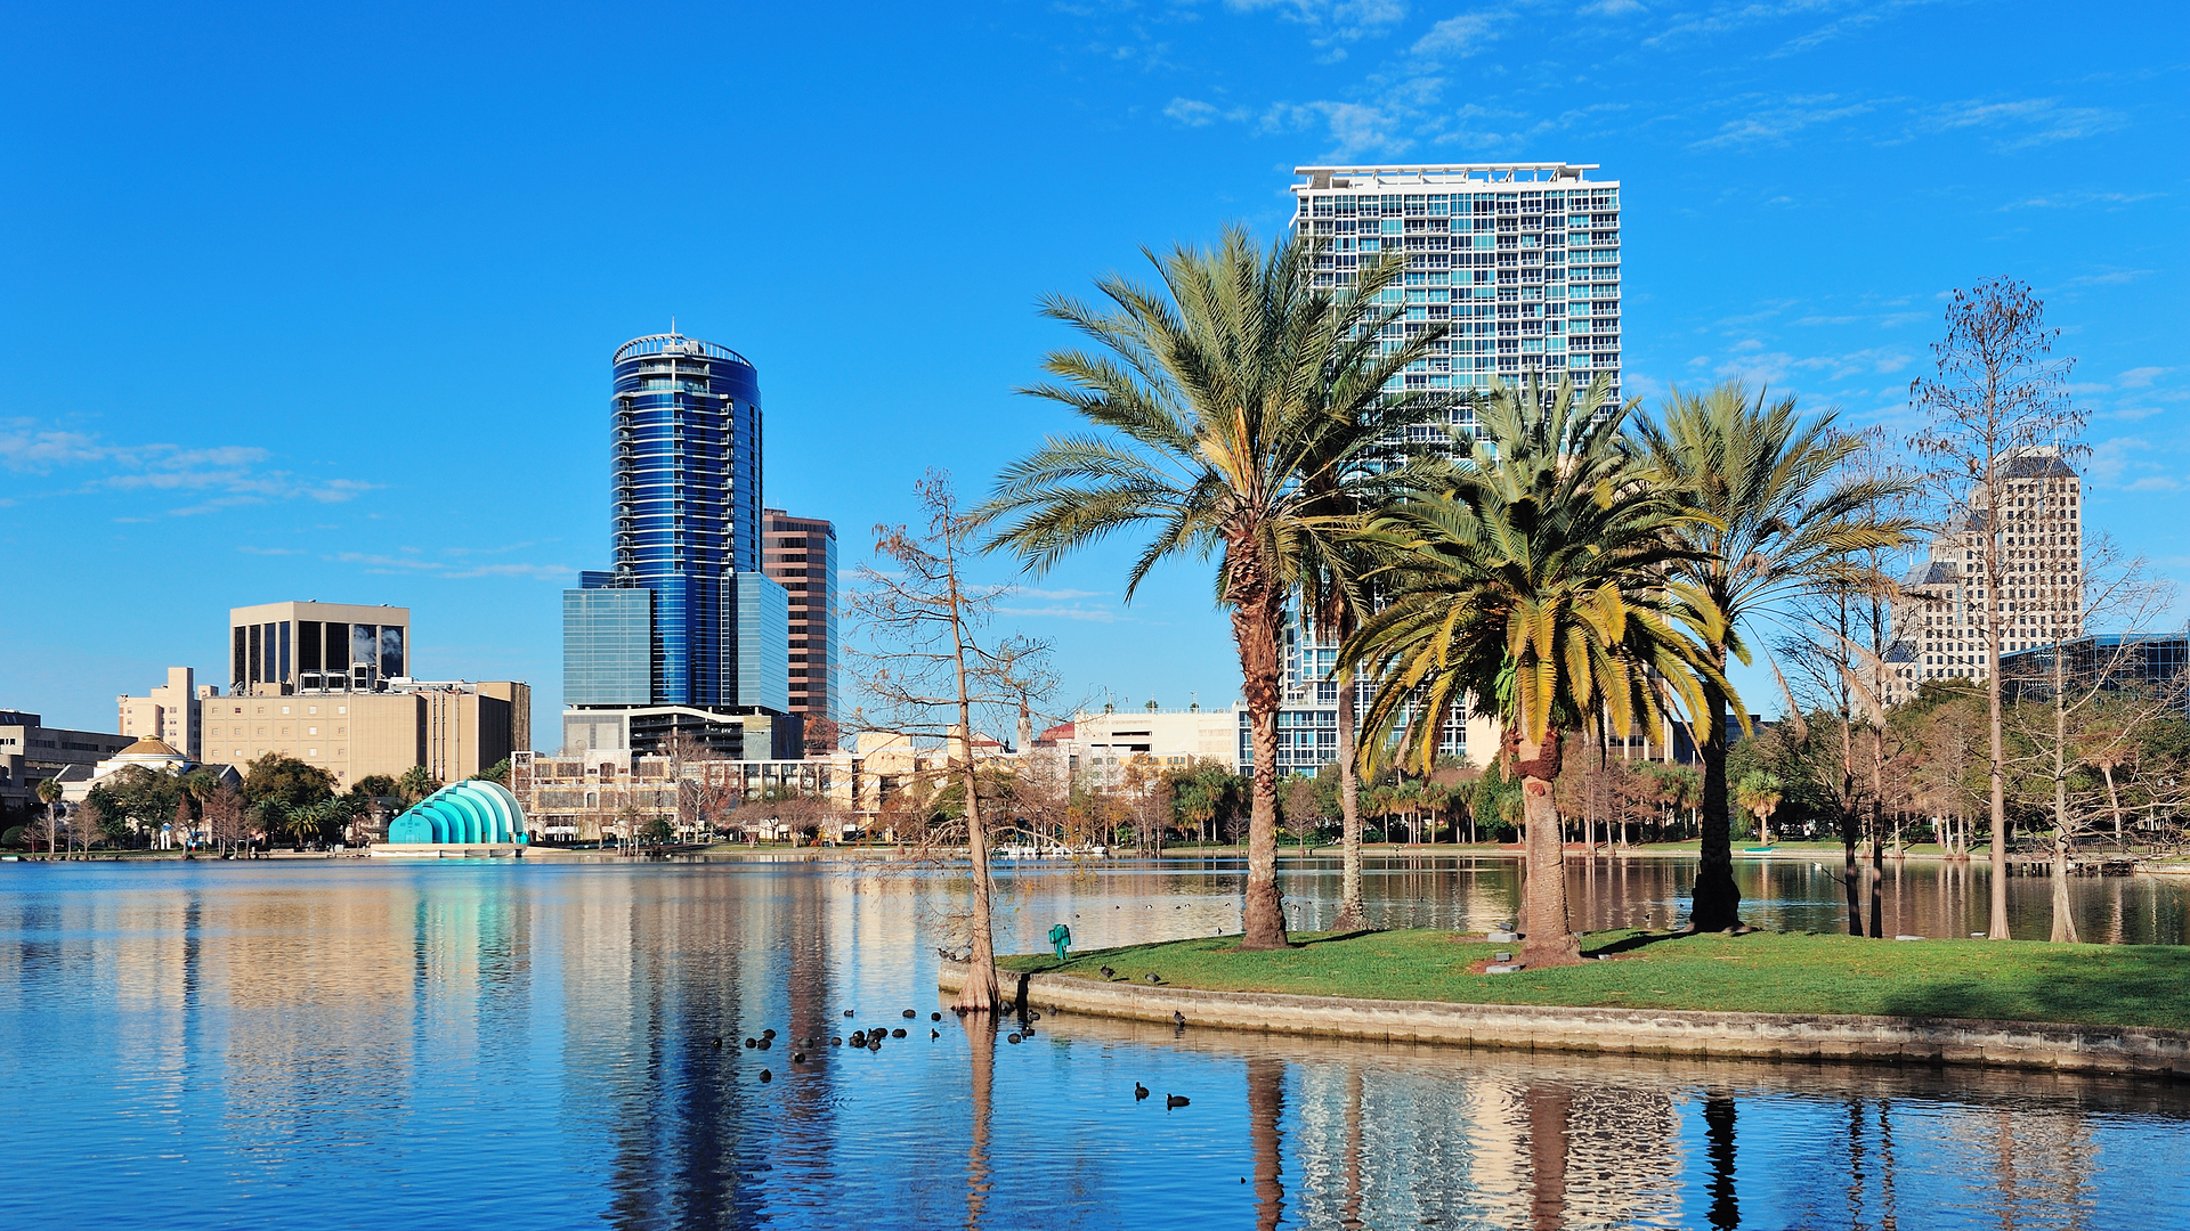
9. Orlando, FL

Overall score: 57.29
Revenue potential rank: 53
Initial investment rank: 37
Overhead rank: 41
Entertainment rank: 8
Safety rank: 143
Climate rank: 71
10. Augusta, GA

Overall score: 57.18
Revenue potential rank: 20
Initial investment rank: 16
Overhead rank: 15
Entertainment rank: 118
Safety rank: 69
Climate rank: 119
11. Virginia Beach, VA

Overall score: 56.24
Revenue potential rank: 6
Initial investment rank: 66
Overhead rank: 146
Entertainment rank: 43
Safety rank: 19
Climate rank: 52
12. Nashville, TN

Overall score: 56.14
Revenue potential rank: 8
Initial investment rank: 95
Overhead rank: 81
Entertainment rank: 19
Safety rank: 126
Climate rank: 99
13. Hialeah, FL

Overall score: 56.12
Revenue potential rank: 51
Initial investment rank: 138
Overhead rank: 2
Entertainment rank: 178
Safety rank: 96
Climate rank: 46
14. Winston-Salem, NC

Overall score: 56.04
Revenue potential rank: 33
Initial investment rank: 80
Overhead rank: 37
Entertainment rank: 83
Safety rank: 11
Climate rank: 80
15. Eugene, OR

Overall score: 56.02
Revenue potential rank: 10
Initial investment rank: 120
Overhead rank: 67
Entertainment rank: 74
Safety rank: 48
Climate rank: 45
Methodology

For each of the 200 biggest U.S. cities, we gathered publicly available data on the factors listed below.
We then grouped those factors into six categories: Revenue Potential, Initial Investment, Overhead, Entertainment, Safety, and Climate.
We eliminated all cities — 11 total — lacking critical data, which resulted in a final sample of 189 cities.
Next, we calculated weighted scores for each remaining city in each category. Finally, we averaged the scores for each metro across all categories.
The city that earned the highest average score was ranked “Best” (No. 1), while the city with the lowest was ranked “Worst” (No. 189).
These are the factors we considered:
- Occupancy Rate in Past 12 Months
- Average Daily Short-Term Rental Rate in Past 12 Months
- Revenue in Past 12 Months
- Median Listing Price per Square Foot
- 1-Year Change in Median Listing Price per Square Foot
- Median Annual Property Taxes
- Average Per-Household Spending on Housekeeping Services
- Average Per-Household Spending on Lawn and Garden Services
- Average Per-Household Spending on Home Improvements
- Average Per-Household Spending on Utilities, Fuel, and Public Services
- Number of Attractions
- Crime Index
- Natural Hazards Index
- Historical Average Annual Number of Extremely Hot Days
- Historical Average Annual Number of Extremely Cold Days
Disclosure: The information you read here is always objective. However, we sometimes receive compensation when you click links within our stories.
Source link


